Excel-lent Data Cleaning: Mastering the Art of Tidy Spreadsheets

From Chaos to Clarity: Building Reliable ETL Pipelines
Efficient data cleaning is one of the most critical steps in data analysis. No matter how advanced your models or dashboards may be, the quality of insights ultimately depends on the quality of your dataset. And while Excel remains one of the most widely used tools for data wrangling, its true power lies in pairing simple functions with smart workflows — and, when appropriate, automating the process with Python.
By automating the “dirty work,” I ensure that:
Accuracy improves - the same logic is applied consistently every time.
Efficiency scales - what might take 30 minutes in Excel can be done in seconds with Python.
Flexibility increases - the same script can handle 1,000 rows or 1,000,000 rows with minimal changes.
The combination of Excel for ad-hoc fixes and Python for automation allows me to deliver clean, reliable data faster—freeing up time for the real goal: extracting insights and telling the story behind the data.
Excel is an excellent entry point into data cleaning — familiar, intuitive, and powerful in its own right. But when paired with Python automation, the process transforms from manual correction into a repeatable, scalable workflow.
Whether you’re cleaning a small dataset for quick analysis or preparing enterprise-scale files for dashboards, mastering both approaches ensures you spend less time scrubbing data and more time unlocking insights.
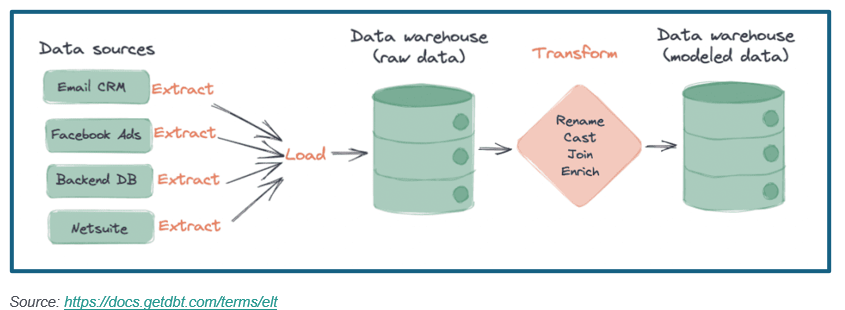
In data analytics, one of the most important steps is ETL: Extract, Transform, Load. ETL pipelines are the backbone of reliable reporting and dashboards. They ensure that raw data — often messy and inconsistent — is transformed into clean, structured datasets that decision‑makers can actually use.
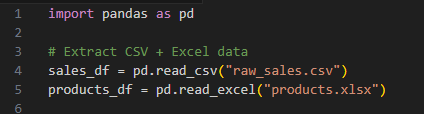
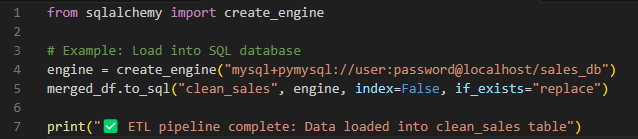
In this article, I’ll walk through the design of a simple ETL pipeline, showing how I’ve automated the process using Python and SQL.
Why This Matters
Automation: No more manual copying/pasting Excel files.
Reproducibility: Same process every time, no errors introduced by hand editing.
Scalability: Can handle thousands to millions of rows just as easily.
Integration: Clean datasets feed directly into dashboards (Tableau, Power BI).
ETL pipelines may not always get the spotlight, but they are the foundation of reliable analytics. By building automated, repeatable processes in Python and SQL, I’ve been able to save hours of manual work while ensuring accuracy across projects.
Whether the destination is a data warehouse or a BI dashboard, strong ETL pipelines ensure one thing: the right people get the right data, at the right time.
Predictive Modeling in Healthcare: Turning Data into Better Outcomes
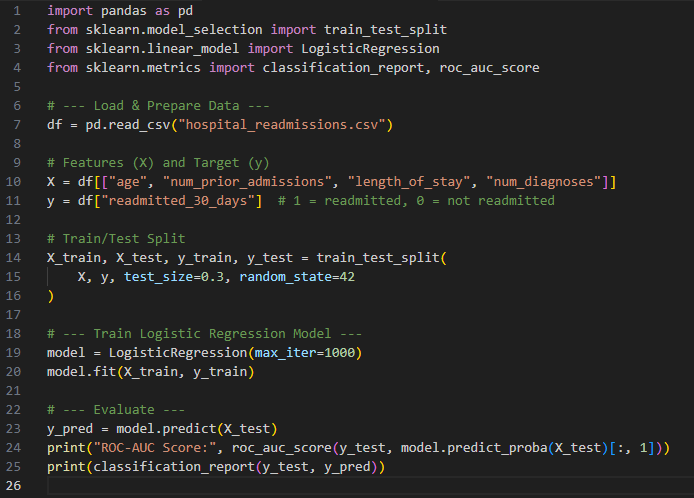
Healthcare generates an extraordinary amount of data — patient records, lab results, claims, and real‑time monitoring devices all feed into massive systems. But data alone doesn’t improve outcomes; the value comes when we use it to predict what might happen next. That’s where predictive modeling comes in.
Predictive models use historical data and statistical/machine learning techniques to estimate the likelihood of future events.
Examples include:
Predicting which patients are at risk of hospital readmission.
Forecasting medication adherence or appointment no‑shows.
Estimating future patient volume for staffing and resource planning.
Identifying early signs of chronic disease progression.
By flagging risks early, healthcare providers can act proactively rather than reactively.
Predictive modeling in healthcare is more than just an algorithm; it’s about bridging data science and patient care. By identifying risks before they become problems, predictive analytics has the power to save money, save time, and most importantly, save lives.